Crypto Beginner Series EP 5: What Is The Fear And Greed Index?
“Each day, we analyze emotions and sentiments from different sources and crunch them into one simple number: The Fear & Greed Index for Bitcoin and other large cryptocurrencies.”
Occam’s Razor tells us that the simplest explanation is usually the best one. This principle is the reason why market analysts enjoy straightforward, binary metrics. These include ‘supply and demand’, ‘support and resistance’, and ‘fear and greed’.
Analysts know that between any of these two extremes lies an infinite gradient of decisions. Each decision is affected by emotions, actions, and outcomes from the flaws of human intellect. By reading between the lines of the order book, price action, and needle, market observers can piece together a real-time story about the state of the market – invaluable information. Today’s beginner blog will examine the story told by the Fear & Greed Index.
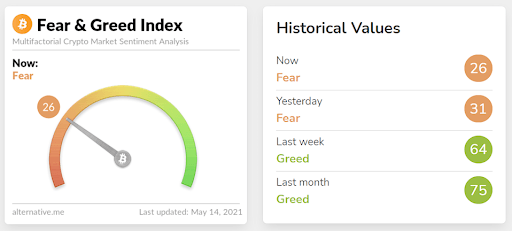
On the index’s scale, 0 represents the highest level of fear “Extreme Fear,” 50 represents neutrality, and 100 represents the highest level of greed “Extreme Greed”. The factors determining the current sentiment are listed below:
Factors Of The Fear & Greed Index
Volatility (25 %)
Volatility is a statistical measure of the dispersion of returns for a given asset or market index. It is typically agreed upon that the higher the volatility, the riskier the asset. The index measures current volatility and compares it to the average values of the past 30 and 90 days.
“We argue that an unusual rise in volatility is a sign of a fearful market.”
Market Momentum/Volume (25%)
Trading volume is the total amount (total number) of an asset that was traded over a given period of time. As the index does with volatility, “current volume is measured and compares it to the average values of the past 30 and 90 days. Generally, when we see high buying volumes in a positive market on a daily basis, we conclude that the market acts overly greedy / too bullish.”
Social Media (15%)
“Through Twitter analysis, we gather and count posts on various hashtags for each coin (publicly, we show only those for Bitcoin) and check how fast and how many interactions they receive in certain time frames). An unusually high interaction rate results in a grown public interest in the coin and in our eyes, corresponds to a greedy market behaviour.”
Surveys (15%)
“Currently paused.”
Dominance (10%)
Dominance can be defined as the measure of an asset’s value in the context of the larger cryptocurrency market. For example, with Bitcoin’s market cap of $681b, it currently comprises 42.8% of the crypto market. This means its market dominance is 42.8% at the time of writing. “We think that a rise in Bitcoin dominance is caused by a fear of (and thus a reduction of) too speculative alt-coin investments since Bitcoin is becoming more and more the safe haven of crypto. On the other side, when Bitcoin dominance shrinks, people are getting more greedy by investing in more risky alt-coins, dreaming of their chance in the next big bull run.” With this line of logic, the opposite applies for altcoins, a higher alt dominance denotes itself as greed, and vice-versa.
Trends (10%)
There are an endless amount of trends to follow in the crypto markets. From hash rate to outflows of exchanges, from Google search trends to total value locked in DeFi. Glassnodes is one platform that displays hundreds of these trends. Each trend tells a story about the interest and emotions in the market.
How To Use The Fear & Greed Index
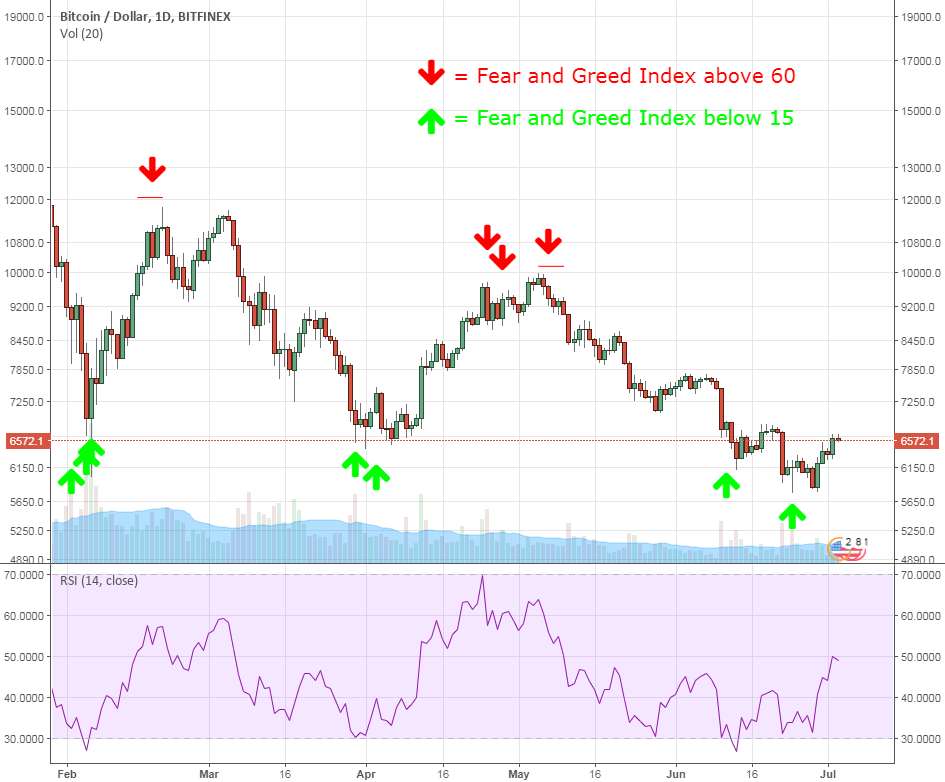
One of the most basic and successful strategies in trading and investing in crypto is waiting. Successful traders wait for the needle to pull significantly in one direction and then act in accordance with the sentiment. The result of buying fear and selling greed in theory allows traders to purchase crypto at a discount when everyone is selling and then sell their crypto at a premium when everyone is buying. Doing this requires you to examine the sentiment of the market, but not feel what it feels.
If you felt the fear when the meter turns to “Extreme Fear,” you would be tempted to sell out of your position when in reality, the market is likely bottoming or nearing a bottom. The same is true for the greed side, you will buy near a cycle’s top. It’s important to note that the Fear & Greed Index is the sentiment of the market, and inside each traders’ head is a microcosm of feelings that tend to mirror the market as a whole.
Remove Your Emotions
It is very easy to get caught up in the sentiment of the market. However, the best traders understand this and have plans in place to avoid it. They keep a clear head while navigating the market analytically without being temporarily influenced by good or bad emotions. Trading is often a flurry of excitement and change, but if you want to be a successful trader, constantly feeling that rush of adrenaline is a no-no.
The same applies to an investor that has built a long-term thesis. Price and the corresponding metrics make up a large portion of the index. However, price means nothing to a convicted investor that understands the value of a selected asset. The key is to remain calm, cool, and collected. Equally important during times of extreme downturn and pressure as well as during times of immense success. Markets are designed to toy with your head and force you to deviate from your plan. For this reason, understanding this index is necessary to stay two steps ahead of the herd and boost your chances of coming out on top.
If you enjoyed this blog, check out “Sentiment Is Everything.” to dive deeper into market sentiment.
Written by Adam Tarlowski