Make the most out of free analytics sites like Coinmarketcap & Coingecko
Whether you are new to crypto or been around for a while, you have probably heard about CoinMarketCap, CoinGecko, or other cryptocurrency aggregator sites. Even though everyone knows of them, why do people often make decisions without utilizing these platforms’ full suite of free services? The answer boils down to understanding. People only use data they understand.
Besides their obvious price metrics, the two sites offer an enormous amount of helpful data, data that is sometimes hard to accurately locate elsewhere. This post will help you understand this data better and how you can apply it to your own decisions within this space.
Below is an essential list of everything you should know about navigating these sites. The popular aggregator platforms are very similar in their format and layout. In other words, regardless of your preferred platform, the tips below will still provide some key benefits.
Commonly Used Tools
- Price: This is the most obvious set of data, and arguably the most referred to. This will provide the current price of one token/coin for each cryptocurrency listed.
The home page is great to scroll through if you want a sense of the market’s direction that day or week. Normally, next to this data will be the amount it has increased or decreased over a 24-hour and seven-day period.
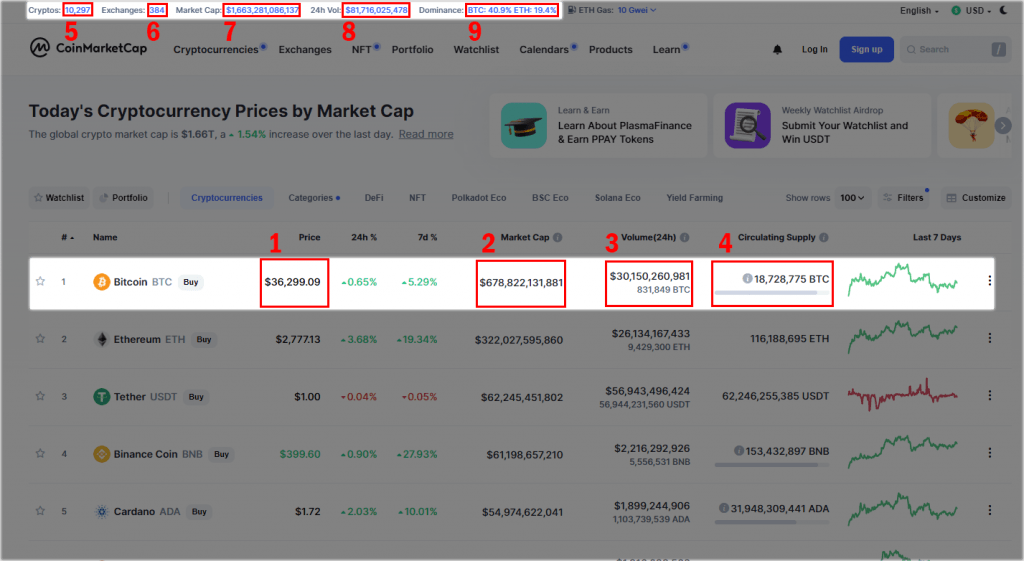
- Market Cap: Displayed in the same area as a coin’s price on the home page, the market cap is a measure of a coin’s circulating supply multiplied by its current price. The equation is as follows: Market Cap = Current Price x Circulating Supply.
This is generally how these sites rank cryptocurrencies, from the largest market cap down. A larger market cap can often (but not always) indicate a more stable coin as it has higher liquidity. The more liquid a coin is, the easier it is to buy or sell it. Combine that with a high market cap and it is quite difficult for large trades to affect its price, providing more price stability.
Lesser Understood Tools
- Trading Volume: This is one of the slightly lesser understood figures. This represents the $ value of how much of the coin has been transacted (bought/sold) in the last 24 hours. This is probably the most definitive indicator of a coin’s liquidity. But keep in mind that these figures can sometimes be misleading. The first thing to check on if something seems out of the ordinary is the breakdown of each exchange’s trading volume. After clicking on the coin in question, one tab will show the breakdown by the exchange. Ideally, you want to see a fairly even spread among the top exchanges. You also want to see a spread across some of the main trading pairs.
- Circulating Supply: The circulating supply is another oft-overlooked stat. This demonstrates how much of a particular coin has been released into the ecosystem. Some coins, like Bitcoin, have a predetermined maximum issuance — that is, there will never be more than 21 million Bitcoin ever created. Other coins, like Tether, don’t have a maximum supply but are managed through other criteria.
Total Coins & Exchanges
- Coin Tracker: On the home page, top left-hand side, the word “Cryptos” (or coins) is displayed with a figure to the right. This tracker counts the total number of coins in existence. It shouldn’t be taken as an extremely accurate number since everyone is making coins and it is sometimes difficult to identify dead ones. Instead, tracking this number you can start to understand how quickly new coins are being minted.
- Exchange Tracker: Located on the main page next to the Coin Tracker, clicking on exchanges will provide a view of every exchange with general statistics and a rating. This is an excellent way to gauge if the exchange you are currently using or considering using is as legitimate as you believe it to be. As a rule of thumb, stay near the top of the list. These tools are great for vetting the platforms you trust with your money and personal information.
Total Market Overviews
- Total Market Cap: Located at the top left of the home page, this impressive blue number can be clicked on to view the entire market capitalization of the crypto market. This gives you an idea of how fast the industry is growing as a whole.
- 24 Hour Volume: Similar to a coin’s 24-hour volume, this demonstrates how active the crypto market is in its entirety.
- Market Capitalization Dominance: This is often located in the same area as the previous two figures. The graphic visualizes the top few coins’ dominance compared to the entire crypto market cap. It offers a perspective on how small your favorite altcoin really is and how Ethereum is slowly gaining on Bitcoin’s dominance.
Coin Specific Tools
- Price Window: From the main page, click on any particular crypto and then scroll down the chart. You can click and hold a window that highlights the historical chart of the asset. This allows you to scan through older price history if you want to know how the asset performed in a particular year, month, or week.
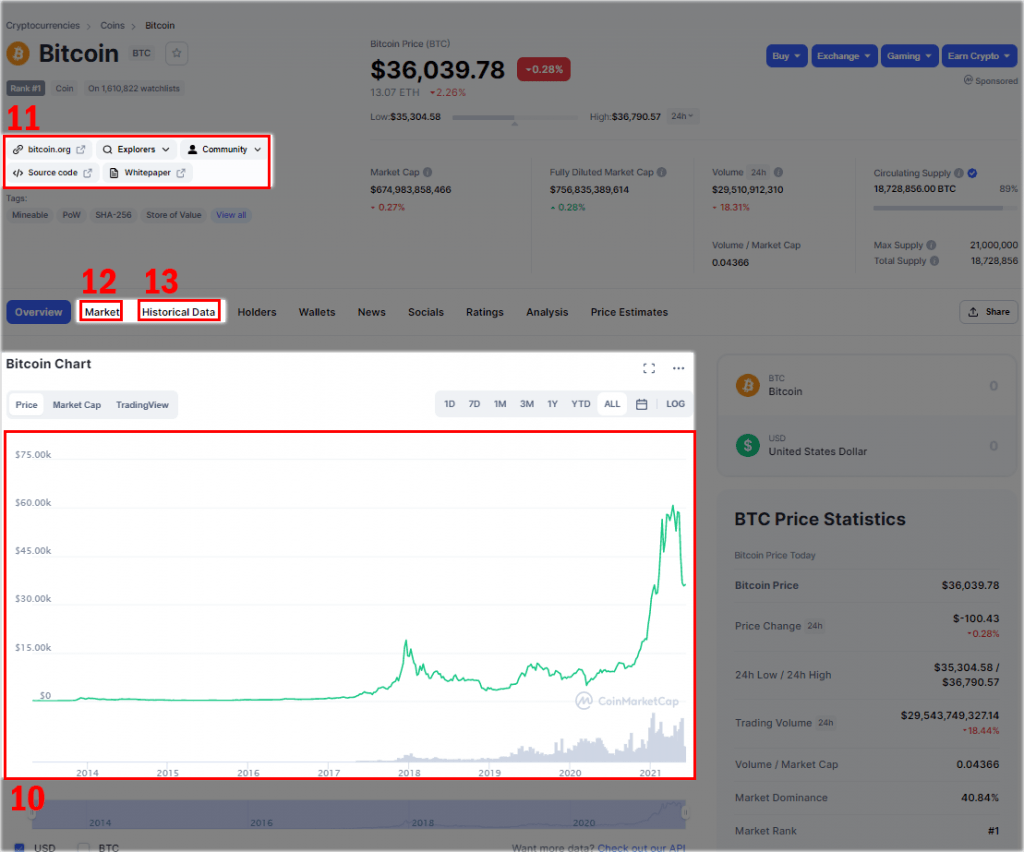
- Linked Resources: After clicking on any particular coin, near the top of the display page contains an archive of helpful and legitimate links in relation to the asset. Take Bitcoin for example, after clicking on it from the home page, 5 separate grey buttons appear offering “bitcoin.org,” “explorers aka helpful sites,” “community,” “source code,” and “white paper.” These links are an excellent launch pad to dive deeper into any coin, plus you can generally count on the provided links to be a good representation of the selected crypto.
Understanding Your Coin Better
- Trading Pairs: This is one of the most underutilized tools offered by these platforms. Learning it can save you a lot of time. It is common that once you have selected a particular coin you’d like to trade, you need to know what pair you can trade it with and where the majority of its trading is occurring. This tool is your friend. After searching for your desired crypto on the home page, click on it and scroll down. At the bottom of the page, you will see the exchanges that have listed the asset ranked in the order of pairs it is most commonly traded. The next time you are wondering where your small-cap gem trades, do this rather than google searching the answer – you will save a lot of time and confusion.
- Historical Price Data: On any coin’s page, scroll towards the middle and click on the “historical data” tab. This page will show you the highs and lows of the price of any day in the available history of the currency. You can also select a calendar to pick certain years, months, or dates to examine.
Much More To Discover
These tips only scratch the surface of what resources and tools these types of platforms offer. Once you have mastered the basics of these sites, take some time exploring their free information on NFTs, airdrops, conversions, DeFi, and more. If you found this blog helpful and are ready to take the next step, think about what you should invest in.
Written by Adam Tarlowski