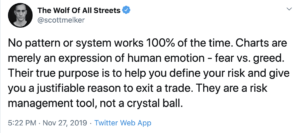
Far too many traders view technical analysis as a predictor of future events. They believe that they can see what is going to happen based on a few lines and candles on a chart. If this was the case, all technical analysts would agree on every chart pattern and all traders would be extremely wealthy with a strike rate of 100%. The reality is, you can show a chart to 100 traders and get 100 different interpretations of where price is headed. In that regard, it is a pseudo science at best and you should be wary of any trader who speaks in absolutes about what is going to happen. They’re trying to sell you something or are emotionally attached to their idea.
As stated in the tweet above, a chart is merely an illustration of the emotions of the markets participants. Are they fearful? Are they greedy? At what point is the pendulum likely to swing between these two poles? That’s what we are looking to identify.
So what is the purpose of looking at a chart at all? For me, a chart is a risk management tool and a way to approach a trade with a definitive plan. This includes where to enter a trade, where to exit in profit and where to set a stop loss at the invalidation point of my idea. Without a chart, managing risk becomes far more difficult, even if all of the lines, patterns and indicators are completely meaningless. At least the chart gives us actionable information. This is why I always say that your method of identifying trades is unimportant – it’s the way you use that method to manage your risk that matters, which is where the chart comes into play.
CHARTS CANNOT TELL YOU WHAT IS GOING TO HAPPEN IN THE FUTURE!
