The talk of the crypto community in the past few months has been the gaps on the Bitcoin CME (Chicago Mercantile Exchange) futures chart. Bitcoin trades 24/7 on major exchanges but does not trade on weekends on the CME. This often creates a gap, or empty space on the chart when trading resumes on the CME.
There is a famous saying in Physics: “nature abhors a vacuum.” This is a postulate attributed to Aristotle, who articulated a belief, later criticized by the atomism of Epicurus and Lucretius, that nature contains no vacuums because the denser surrounding material continuum would immediately fill the rarity of an incipient void. People have expanded the concept to apply to many facets of life — including trading and technical analysis.
A gap is an unfilled space or interval on a chart, caused by sharp movement in either direction. In an upward trend, a gap is produced when the highest price of one candle is lower than the lowest price of the following candle. Conversely, in a downward trend, a gap occurs when the lowest price of any candle is higher than the highest price of the next candle.
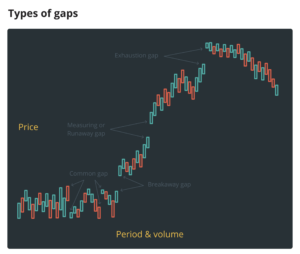
There are four types of gaps and they are traded in different manners. It is essential that investors be able to differentiate between them.
- Breakaway gap — This gap is seen when price makes a strong directional move from an area of consolidation. It is particularly powerful for traders when combined with clear patterns on the chart like trading ranges and ascending and descending triangles. A breakaway gap with significant volume after the gap is a sign of a strong trend and is unlikely to be filled. A low volume move creating the space is more likely to see price returning to the area. Bottom line — breakaway gaps are less likely than other types to be filled.
- Common gap — These are also known as area gaps, pattern gaps, and temporary gaps. These are the gaps that traders see most often in trading ranges and during sideways movement. They are often filled but offer very little information on what price is likely to do after this occurs. They rarely exist within a notable price pattern on the chart — they are simply areas where there was minimal trading that is likely to be filled.
- Exhaustion gap — This type of gap is viewed as a signal that a trend is ending and that a new pattern or trend is likely. They occur near the end of a price pattern and signal a final attempt to hit new highs or lows. Exhaustion gaps generally occur in an area of rapid advance or decline, often on a large move straight up or down. They are normally preceded by a heavy volume spike and often foreshadow a “blow-off top” in an uptrend. These are the most likely gaps to be filled.
- Measuring Gap — also known as a runaway gap or continuation gap these gaps occur in the middle of a price pattern and signal a rush of buyers or sellers who share a common belief in the underlying asset’s future direction. Measuring gaps do not occur during consolidation or in an area of congestion. They occur during a rapid price incline or decline. Runaway gaps are not normally filled for a considerable period of time, if ever.
A common mistake when trading gaps is confusing exhaustion and measuring gaps. This can cause an investor to position himself incorrectly and to miss significant gains during the last half of a major uptrend.
Keeping an eye on the volume can help to find the clue for discerning between measuring gap and exhaustion gap. Normally, noticeable heavy volume precedes the arrival of an exhaustion gap.
Exhaustion and measuring gaps predict moves in opposite directions, so it is essential to understand the difference. Also, it is important to note that once a gap starts to fill, it rarely stops — because there are no immediate areas of support and resistance within the gap.
The bottom line? Measuring gaps and breakaway gaps are far less likely to be filled than exhaustion and common gaps. Understanding the difference between the types of gaps can help traders and investors make money in every market.