If you have been following me for a while, then you know that my single favorite strategy for identifying trading opportunities is bullish and bearish divergences. In my case, I primarily use RSI, but the strategy is the same regardless of the indicator. This is a very basic first guide on RSI and divergence basics – I will expand upon it in future issues.
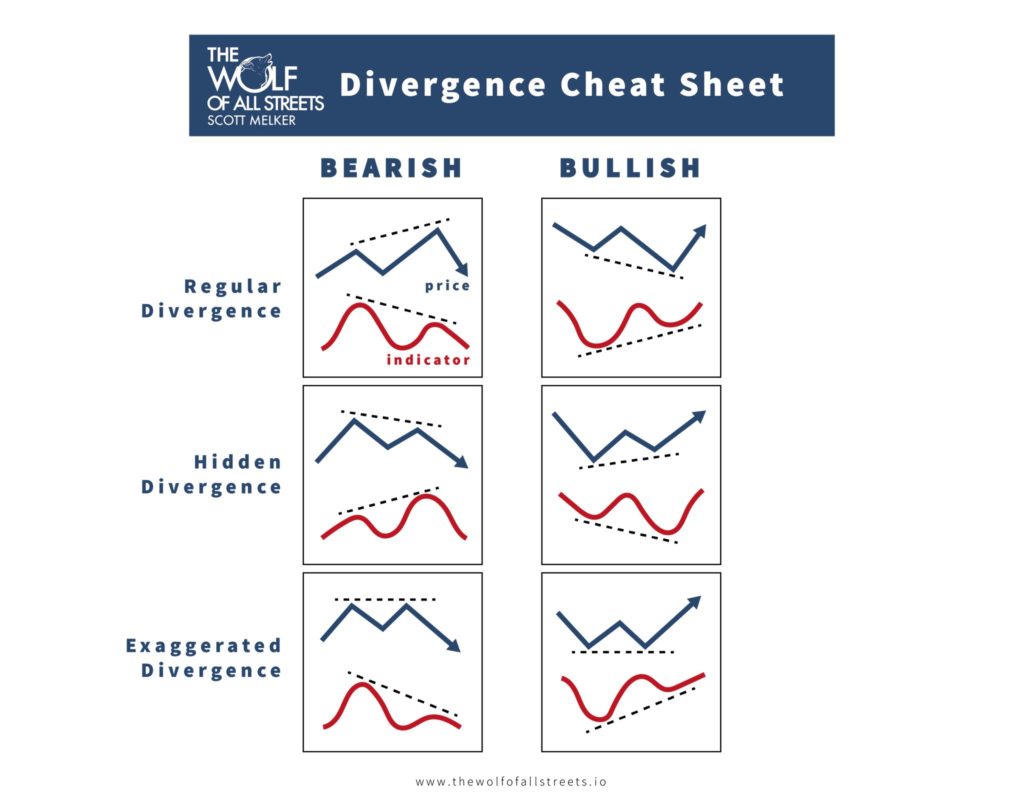
Here is a basic cheat sheet for identifying divergences. Today we will focus on regular (or standard) divergences.
What is RSI?
RSI stands for Relative Strength Index. It’s a momentum indicator, which means that it measures the speed (or strength) of the movement of a price. More specifically, it compares the magnitude of recent gains and losses over a specific time period. That time period is usually configurable and you’ll see that a popular period is 14, meaning that it will use the last 14 candles in the calculation.
All of this is normalized to a scale of 0 to 100. So if the RSI indicator is closer to the lower end (let’s say 20), this means that the price has been in a downtrend for a while now and is in the oversold area. However, if the RSI indicator measures closer to the higher end (for example 80), it signifies that the price has been in an uptrend for a while and is in the overbought area.
You have probably heard the following strategy for RSI many times – it is unreliable!
- If the RSI indicator is greater than 70, the price is overbought and you should sell.
- If the RSI indicator is below 30, the price is oversold and you should buy.
Price can keep going up, long after the RSI indicator showed a value larger than 70. And the price can keep going down for a long time after the RSI measured a value lower than 30. Simply put, RSI overbought and oversold regions are not reliable signals to go long or short.
Enter Divergence!
A regular RSI divergence (not hidden) is when the price makes higher highs in an uptrend and the RSI indicator makes lower highs. Or in the other direction: when the price makes lower lows in a downtrend and the RSI indicator makes higher lows.
Remember that the RSI indicator is a momentum or strength indicator. As long as the price and the RSI indicator line up, we can say that the current trend or price move is showing momentum in a specific direction. But once we see the price and the RSI indicator diverge, this momentum is fading. RSI divergence indicates that the current trend is losing strength. RSI divergence shows us that the current trend is losing momentum and the conditions are setting up for a trend reversal. These are the early stages of a momentum shift, and that’s exactly what we’re looking for as reversal traders. They are by far the most powerful in overbought and oversold territory.
Drawing Divergences
There are a couple of things you need to keep in mind when drawing divergences. During an uptrend, you connect the highs (and not the lows!) in order to detect a divergence. At the same time, we connect the highs and not the lows of the RSI indicator. These highs and lows must coincide – you have to compare the exact same date or time on price as on RSI.On the other hand, if we are in a downtrend, we need to connect the lows (not the highs) of a price trend and the lows of the RSI indicator as well.
Using A Line Chart
Divergences can be confusing on a candle chart, because traders often argue as to whether they should use wicks or real candle bodies. Using a line chart, rather than a candle chart, can eliminate the noise. Line charts are calculated solely on candle closes, so they give a stronger divergence signal.
How to Trade It
There are numerous strategies for trading with RSI. I prefer to take a position when the divergence is confirmed – when I see the defined “elbow” on RSI after a candle close. It is important to watch for a divergence on the other side (hidden bearish or bearish divergence) to indicate that the div has completed or is invalidated. I will sometimes take a position before confirmation if the div looks very likely to confirm, but this is very risky and not recommended until you are very comfortable identifying these opportunities.
Bitcoin Divs Since All Time High (As Of March)
BTC by ScottMelker on TradingView.com
This is a quick chart that I just drew up of daily divergences with RSI on the Bitcoin chart since the all time high. I may have missed some. This DOES NOT INCLUDE SOME HIDDEN DIVERGENCES, which have also been very powerful. Nearly every top and bottom for the past few years has been preceded by an overbought or oversold divergence. This is the case on almost any chart of any asset that you look at.
The Bottom Line – The Quick Notes
- Divergences with RSI are a powerful tool for identifying likely price reversals
- They are most powerful when they occur in overbought and oversold territory
- They have been present at nearly all Bitcoin tops and bottoms
- It is essential that you compare the exact same points on RSI and price
- A divergence is confirmed when RSI makes a definitive move in the opposing direction, creating an elbow or point worthy of comparing to price
- Traders expect RSI to travel to overbought once it is oversold and to oversold once it is overbought